The Complexity Behind the AAPI Inclusion: Who Counts?
Disaggregating data can help community colleges move beyond the “model minority” myth and better serve all Asian American and Pacific Islanders.
In the summer of 2015, the White House hosted the historic first all-day Summit for the White House Initiative on Asian American and Pacific Islanders (WHIAAPI), welcoming from across the country some 2,000 opinion leaders in the areas of health, education, civil rights, immigration, and economic and community development. WHAAPI Executive Director Kiran Ahuja opened a packed day of sessions, illuminated by panels and participants from the highest level of national leadership from Congress and the President’s Cabinet, and punctuated by cultural celebrations in the performing arts. White House summits are coveted venues that give high visibility to emerging, urgent national issues. We only have to look to the most recent White House convenings on college opportunity and community colleges, and how these dialogues informed the President’s proposal of free community college education in America’s Promise.
Growth and Complexities
So what is the impetus behind the scale and scope of this historic convening on Asian American and Pacific Islanders (AAPI)? Why now? The answer is at once direct and complex. The simple answer points to the sheer growth in numbers. AAPIs represent the fastest expanding racial group, growing at four times the rate of the total U.S. population. AAPIs will exceed 47 million by 2060.
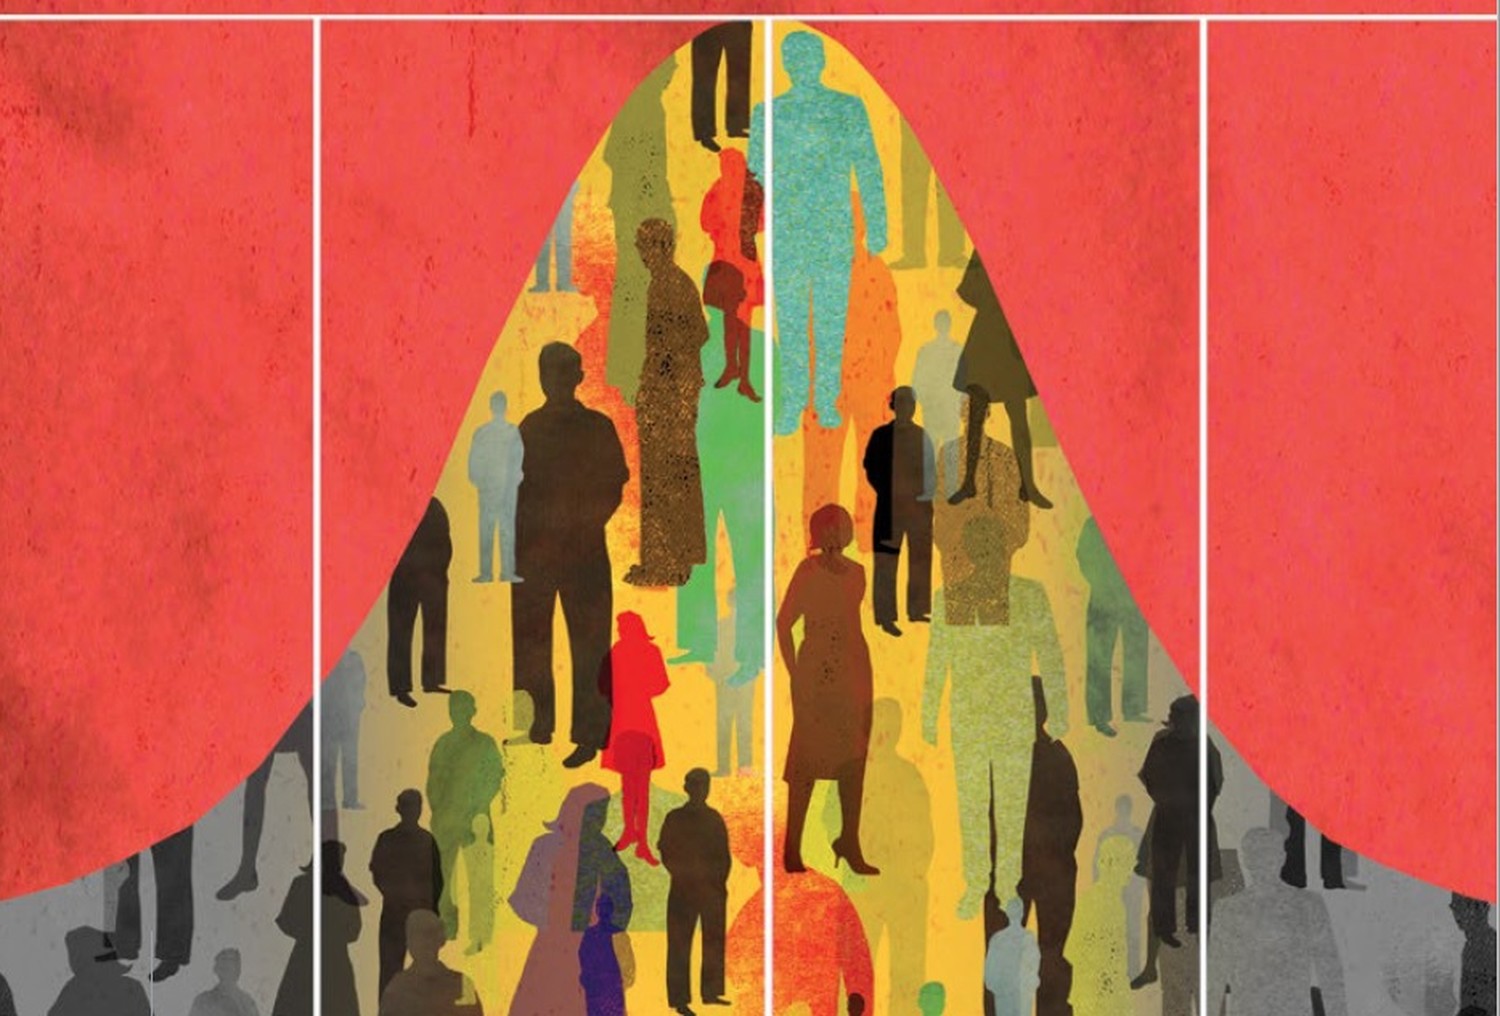
The complexity and challenges behind this growth pattern, however, is often obscured by the perception of AAPIs as a monolithic and homogenized group. The high-achieving Asian students in our schools and colleges, the vast number of accomplished Asians in the STEM fields, the self-sufficient and upwardly mobile Asian professionals — these are the AAPI images uppermost in the American public’s consciousness. In this stereotypical world, AAPIs are rarely bedeviled by poverty, lack of academic preparation, unemployment, and inadequate health care. The “model minority” myth continues to taint public understanding, and it poses a barrier to public policies and programs that must attend the anticipated population growth.
As we examine the disaggregated population data in the iCount report, published by the National Commission on Asian American and Pacific Islander Research in Education (CARE) and WHIAAPI in advocating for data quality in AAPI research, it becomes clear how much the model minority myth, bolstered by undifferentiated population data, has obscured the true picture. The report identifies some 29 subgroups within the AAPI population, with wide variations in socio-economic status and educational attainment. As much as we note positive signs of stability and affluence, the deficits are just as stark, troubling, and entrenched. High dropout rates, poverty, barriers to higher education, and social mobility are all present within the subgroups, mirroring the urgent issues prevalent in low-income urban and rural communities of color. The projected AAPI population increase in the coming years will only exacerbate the need for programs and policies to address these deepening issues.
The White House convening this past summer was certainly an unprecedented celebration of AAPI heritage and achievements. Even more importantly, it was a defining point in our national dialogue, where we take racial perceptions about AAPIs beyond the model minority myth to explore fundamental questions about disparities in the AAPI subgroups, and how to craft better public policies to lift the attainment of a growing segment of the American population. The summit brought onto the national stage concerns and debates that, until now, existed in the echo chambers of race-based organizations and some community colleges.
In its struggle to tell the full story of an American experience, AAPIs are no different from our African American and Hispanic/Latino brethren. Until the full story is told, until individual experiences inform the experience of the whole, until there is nuanced understanding of ethnicity, language, immigration, generational histories and socio-economic variations within the sub-populations, there can be no meaningful policies, programs, or full inclusion of AAPIs in the dialogue of our nation. The summit was a start, and the White House has called to us to continue this work.
AAPI Subgroups: Profiles and Realities
The iCount report recognizes Asian American and Pacific Islanders to be two distinct categories; it further identifies subgroups under each. Two categories and their respective subgroups represent wide-ranging geographic disbursement, socio-economic backgrounds, and educational attainment. There are some 29 subgroups under the AAPI designation:
Asian Americans
- Asian Indian
- Bangladeshi
- Bhutanese
- Burmese
- Cambodian
- Chinese (except Taiwanese)
- Filipino
- Hmong
- Indonesian
- Japanese
- Korean
- Laotian
- Malaysian
- Nepalese
- Pakistani
- Sri Lankan
- Taiwanese
- Thai
- Vietnamese
- Other Asians
Pacific Islanders
- Native Hawaiian
- Samoan
- Tongan
- Guamanian or Chamorro
- Marshallese
- Fijian
- Other Polynesian
- Other Micronesian
- Other Melanesian
- Other Pacific Islander
The socio-economic range of these groups spans the spectrum, from low-income to high-earning. An examination of median household income of AAPIs from 2008 to 2010 finds that the Hmong, Bangladeshi, and Cambodian groups are some $20,000 below the median, while the Asian Indian and Filipino groups anchor the more affluent and high-skilled end of the spectrum at more than $10,000 and more than $20,000 above the median, respectively.
A look at educational attainment during that same period from 2008 to 2010 echoes a similar theme of wide-range differentiation among the subgroups. Hmong, Cambodian, and Laotian subgroups have the highest percentage of individuals with less than a high school diploma, while over 70 percent of Taiwanese and Asian Indian subgroups earned a bachelor’s degree or higher, according to the iCount report. Even the well-rehearsed refrains of over-representation of AAPIs at elite colleges can benefit from a reality check: While a number of subgroups, such as Chinese (including Taiwanese), Asian Indians, and Koreans have higher representation, far many more subgroups have disproportionately lower representation, among them Hmong, Samoan, Thai, and Filipino, the report says.
With the wide variations manifested in these key indicators, it is not surprising that there is a corresponding wide range of student achievements among the subgroups. The myth of the high-achieving Asian student, like that of the model minority, is a distortion that obscures the hidden achievement gap with high praise, a distortion that provides no clarity for the high-achieving and no remedy for those struggling in the shadows.
Action Steps
To leverage the notice and momentum of the historic national convening, we call to action the leadership of our nation’s community colleges, along with state education leaders, trustees, presidents and CEOs, foundation boards, leaders of professional associations, reform networks, and communities of practice. The majority of low-income and first-time college-attending AAPI students are in our institutions and at our door. Nearly 150 of our public community colleges are AANAPISIs (Asian America Native American Pacific Islander Serving Institutions), in which at least 10 percent of their enrollment are AAPIs and underserved. Our ability to tell the full story of AAPIs, and our programs, practices, and policies are powerful tools to lift struggling students into success. We present the following agenda for your consideration:
Ask for Better, Disaggregated Data
- Request disaggregated data in your institutional effectiveness reporting, and insist on accompanying narrative about language, socio-economic and immigration factors, and geography that places your data in context.
- Ensure that strategies and programs are based on disaggregated data, as well as the cultural context of the local communities.
- Advocate for disaggregated data in AAPI and other minority population reports at the local, regional, and state level.
Build AAPI Inclusion in Core Curriculum, Pedagogy, and Advising
- Curriculum, pedagogy, and advising practices are at the heart of our institutions. If inclusion is to be sustainable, it must live in the classroom and advising practices. Seek out powerful reforms that value culturally relevant and community based curriculum.
Build a Pipeline of Leadership and Create Role Models for Students
- Consider AAPI inclusion as an integral factor, and not an add-on, in talent recruitment.
- Encourage internal talent development and participate in regional and national professional development activities targeting emerging AAPI leaders.
- Proactively recruit AAPI teachers and mentors to ensure there are role models for students.
Insist on Systemic Understanding and Systemic Change
- Serve as purveyors and facilitators of AAPI knowledge among civic, philanthropic, educational, and governmental institutions.
- Initiate and convene public and organizational policy discussions to further the work of AAPI and minority population inclusion.
Pam Y. Eddinger, Ph.D., is president of Bunker Hill Community College in Massachusetts.
